1.0 Introduction
If you have any experience at all with 'scrobbling' (i.e., reporting) the plays of your music tracks to Last.fm, you'll be aware what a rich source of data it is and how you can dig into your listening habits in interesting and informative ways.
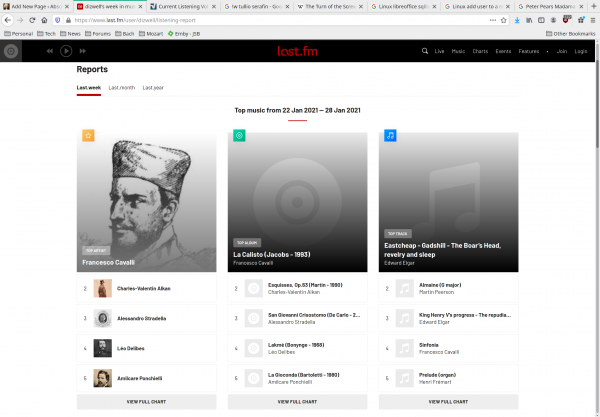
For example, this page tells you (at the time of writing) that Britten was my top composer, with Bach a close second. This one, however, tells you that I am inordinately fond of playing Vaughan Williams' Sir John in Love. It's even possible to get very fine-grained analysis of one's listening habits:
Apparently, this past week consisted of a lot of Francesco Cavalli and quite a bit of Edward Elgar.
Now, for a lot of people, this sort of self-introspection about one's listening habits is of no interest at all! And that's fine: this article is not for you, then! But if you are interested in any listening patterns that emerge from your classical music listening over time, and you're using my own AMP player to do your listening with, then this article will explain how you can construct such informative reports from the listening records maintained by that player itself, whether or not it scrobbles to Last.fm (AMP can scrobble to Last.fm, but not everyone's keen on sharing their listening habits with the world! This article is about the private records that AMP keeps on what you listen to).
If you want to follow along with the specific data shown in this article (rather than your own database of music played by AMP), you can download my own database (called 'main.db') by clicking on this link. You should then save it (or move it after downloading it) to $HOME/.local/share/amp folder. The tools mentioned in Section 3 and beyond can be pointed at the database wherever it's stored, but the basic reporting mention in Section 2 only works if the database is stored in that specific location.
2.0 The Basics
AMP optionally uses a database to store details about what music you have and what music you listen to. It defaults to not using a database -and if that's your pleasure, then you can stop reading this article now, because without somewhere to store your 'listens', you're not going to be able to report on them historically!
So, for the sake of all that follows, let's say that I launch AMP with the following command:
amp --musicdir=/sourcedata/music/classical --usedb --dbname=main --selections=3
That is, I'm using a database and it's name is "main".
Knowing that, it's possible to get AMP itself to report on 'listens' made with it as the music player. Type this command in a new terminal session:
amp --report --dbname=main
...and you'll see something similar to this appear:
It's a simple list of what 'albums' you've played, since you started using AMP. There are no filters possible, so you can't say 'show me last week's plays', or 'sort by composer': it's a simple, chronological list since the first time you played anything with AMP using a database back-end. You can scroll up and down the list, using the up- and down-arrows (or the PgUp and PgDn buttons, to get through things more quickly), but that's basically it as far as AMP reporting by itself is concerned.
Future versions of AMP may give you more control over what gets reported and in what order... but I wouldn't hold your breath!
3.0 Introducing SQL
To get more capable reporting, you need to understand two things: 1) AMP's database back-end is using an open-source database product called sqlite3. And 2) all databases can be interrogated using Structured Query Language, or SQL.
SQL is quite like a normal language: there are verbs and subjects and there are modifiers. The only verb we need to worry about now is "select", which means "fetch me data". The only subject we need to care about is a 'table' in the database, referenced by its name. In AMP, the table (think of it as a spreadsheet of rows and columns) is called plays
At it's simplest, therefore, you can say this to a sqlite3 database:
select * from plays;
"*" in that 'sentence' has a special meaning of 'all rows and all columns of each row' -it basically means "everything". Note, too, that we always terminate our queries with a semi-colon, so the program knows we've stopped 'speaking', just as we terminate our sentences in plain English with a full-stop (or period, if you are of that persuasion!)
We can get more interesting by adding modifiers to our SQL 'sentences'. The three big modifiers you should get familiar with are 'Where clauses', 'order by clauses' and 'group by clauses'.
Where clauses simply limit what is returned. If I said "select * from plays", it means 'return details of every play I've ever made with AMP'. But if I say, "select * from plays where playdate > '01-Feb-2021'", I'm saying that though I want to see all the details of plays, I'm now only interested in ones that took place after a certain date and time.
Order by clauses, as their name suggest, change the order in which rows from a table are returned. Thus "select * from plays" returns all play records, but we don't know what order they will be listed in -it's probably in the order they were made, but you can't actually guarantee that. But "select * from plays order by playdate" definitely ensures that the records will be listed in the ascending date in which the play records were created in the first place. You can also do "select * from plays order by playdate desc" and that will list things in the descending date of their play, so that the report will list things from the most recent play backwards, ending in the first ever play recorded.
Finally, group by clauses get very interesting indeed. At their simplest, they let you group things together by some criterion or other, so that you can count them. For example, "select artist from plays" will list every single play, but only display the artist name from each record. But "select artist, count(*) from plays group by artist" will not only display the artist name (i.e., the composer), but will sort things so that all the plays of music by the same composer are grouped together. Only when you've done that can you then meaningfully count the members of the group, and discover that you've played 5 things by Georgy Sviridov and only 1 thing by Henry Purcell!
Don't worry if that all sailed over your head. Once you start querying a database, you'll get the hang of what works and what doesn't fairly quickly. The main thing is: SQL is a language and not so different to English, in that you say what records you want to see, from what table, in what order, and with what grouping applied. Get that under your belt and you'll be fine!
4.0 A Dedicated SQL tool
There are lots of tools you could use to query the SQL database that AMP stores its data in, but the simplest to obtain and to use (I think) is the DB Browser for SQLIte. It's freely available and opensource. The Downloads page on that website shows that it runs on Windows, MacOS and pretty much every Linux distro known!
On Linux, the program is called sqlitebrowser so, using your distro's package manager, you should be able to install it by that name. On Manjaro, for example, sudo pacman -S sqlitebrowser will get it installed; on Ubuntu, sudo apt install sqlitebrowser should do it, and so on.
Read the Downloads page to see if any special instructions apply to you.
Once you've installed it, you can launch it from your distro's start menu in the normal manner. It's start-menu icon looks like three Trebor mints stacked on top of each other -or a three-ring oil barrel, depending on your childhood experiences!
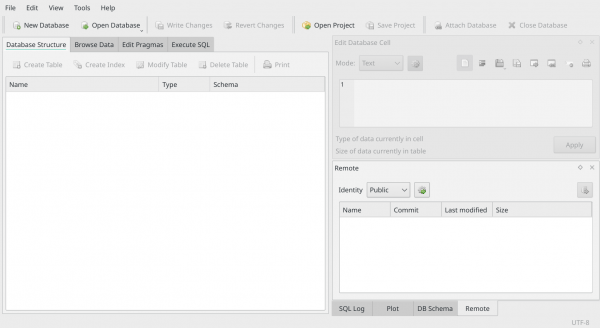
The program's main display area is not terribly complicated to work out:
At the top, you've got options to create a new database, open an existing one, and to close a connection to one. There's a large panel on the left, where you'll see the contents of a database you open, and tabs that let you explore those contents by browsing or by issuing SQL commands. On the right, you've got two vertically stacked panels that we won't be using: they let you edit data in a database and do other advanced things we won't get to in this article.
Incidentally, can I say right up-front that using these tools to modify the data in AMP's database is a recipe for corrupting the database completely. If you know what you're doing and don't mind taking the risks, be my guests. But for the purposes of this article, assume that the tool is a data reader, not a writer, please.
5.0 Getting Started
So, with the SQLIte Browser running, your first job is to open the AMP database. That is always located in the $HOME/.local/share/amp folder.
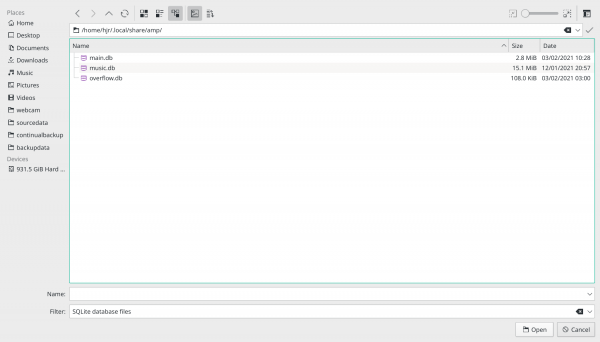
So click the Open Database button on the DB Browser's top button bar. It should open you automatically in your $HOME directory, with the display of hidden folders (i.e., ones whose names begin with a dot, period or full-stop) already switched on. You just need to double-click on .local, then on share, and finally on amp:
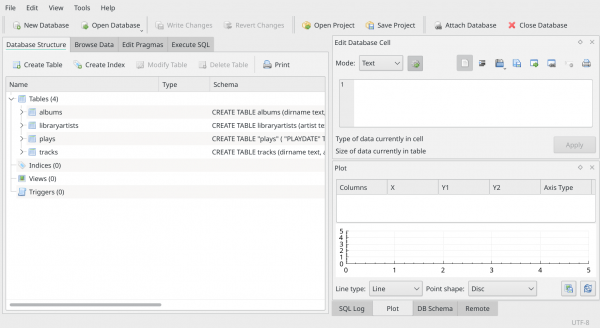
In my case, I finally end up seeing three different possible databases (they all have the .db extension, which helps you spot them!), because I've used AMP to create a main database, an overflow one ...and I accidentally let it create a 'music' one, which is the default name for an AMP database when you don't specify your own. So I'm going to single-click on the 'main.db' file, and then click the [Open] button in the lower-right. Immediately, the DB Browser's main display area changes:
The left-hand panel now contains 'something'! In fact, it's displaying what 'things' are contained within the database file you just opened. In my case, it shows that AMP's database consists of 4 tables (think of them as equivalent to spreadsheets: rows of data, each row made up of several columns). In fact, that's only true if you've ever done a full database refresh with AMP: a fast-refresh (the default refresh mechanism) doesn't create a tracks table, so if you've never done a full refresh, you'll only see tables albums, libraryartists and plays.
So now you know the structure of the AMP database. Now click on the 'Browse Data' tab along that top row of tabs:
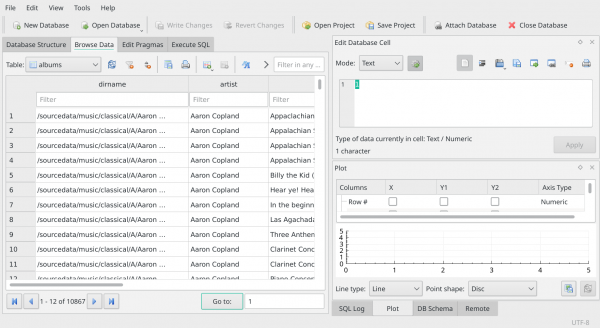
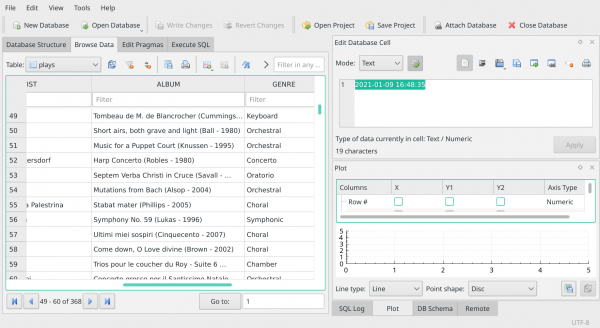
Now the main panel changes to display the actual rows of data making up one of the tables: it tends to display the first table alphabetically, so in this case it's the 'Albums' table that's being displayed. But you can click on the drop-down box just under the row of tabs and select any other table you like:
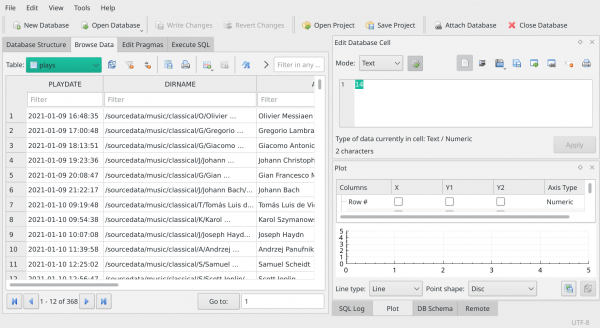
Here's me selecting the 'Plays' table, for example:
Notice how in all cases the data disappears on the right: the panel is not big enough to display it all. But you'll notice at the bottom of the panel a horizontal scrollbar which allows you to scroll the data panel back and forth, so you can see all the data making up each row. There's also a vertical scrollbar on the right of the panel that lets you scroll up and down, so that you can see every row. Underneath the panel, there's also a set of 'play, fast forward and rewind' buttons that let you step through the rows in the displayed table in a more 'granular' fashion than the vertical scrollbar allows.
So this simple browsing technique is a good way to get familiar with (a) the columns that make up each table; and (b) the number of rows in each table (from the above screenshot, for example, you can immediately see that I have recorded 368 plays in the Plays table.
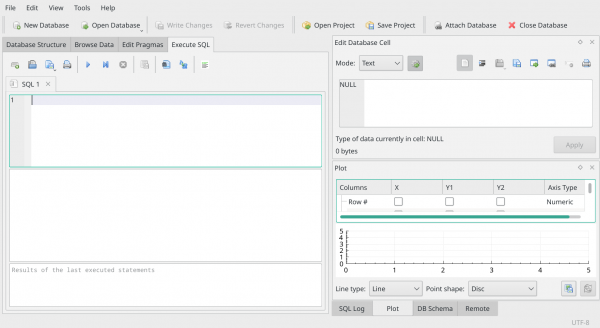
But now click on the 'Execute SQL' tab:
The data has disappeared! So this might at first glance look less than helpful. But in fact this is where most of your database querying and reporting work needs to take place -because it's here that you type in any valid SQL statement and see the results.
I would point out before we go any further: note that no data is displayed on the screen at this point, even though we were previously viewing the Plays table in the 'Browse Data' tab (and if you clicked it now, you still would be!) The Execute SQL tab is not 'tied' to a table you previously selected. You can use it to type any SQL statement that queries any of the tables contained within the database.
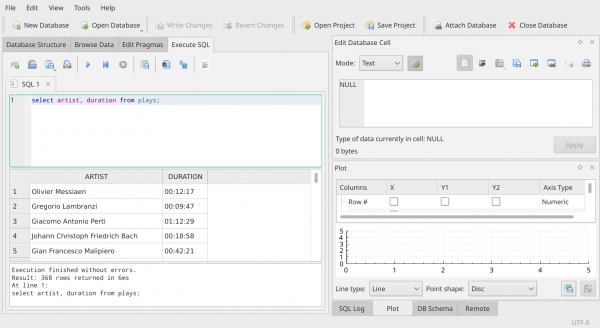
So let's do a simple one to get started. Let's say we want to see the composer and the duration of everything played, ever. So, remembering our basic lessons in SQL, the verb is going to be 'select', the table is going to be 'plays', and the rest of the statement looks quite logical:
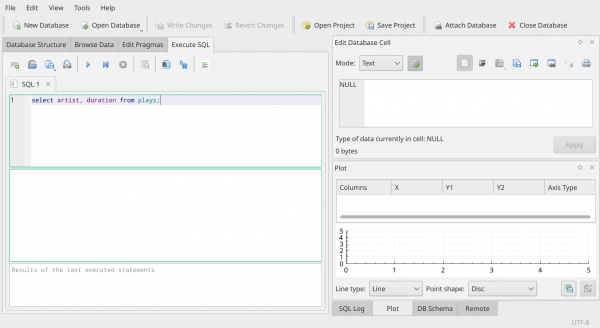
select artist, duration from plays;
You type that in exactly in the top pane of the Execute SQL panel, like so:
Notice that the program nicely colour codes things for you: verbs are in dark blue; table names are in teal; column names are in purple.
Now, to run this SQL statement, you can either press the F5 key; press Ctrl+Enter (that is, hold down the left-Ctrl button, and with it still held down, press the Enter button); or you can click on the big blue 'play' button that appears above the SQL statement, next to the printer icon. Any of those techniques will cause the SQL statement to be run against the database and the results (if any) will be displayed in the panel beneath the SQL statement, like so:
Do you see that, with your own SQL statements, you can be selective about what data to display, compared to what you get in the 'Browse Data' tab, where you simply see every column of every row? That's the point of SQL: you get to choose the columns you're interested in... and also the rows you want to see. You don't have to take everything unless you want to!
5.1 Where Clauses and Wild Cards
Let's modify our query to restrict the rows we want to see, just to make that point. How about we ask to see only the plays that belong to... say.... the composer of the piece called Lincoln Portrait. Say I can't remember who composed that right now -and even if I could, I can't remember how to spell his name correctly!
Well, we know that ARTIST is a column in the table -but we can't really use that to restrict the data, because we don't know the artist's name in question (and we can't spell it anyway!). Is there another column in the Plays table that could help us? Take a look:
The Browse Data tab shows us that there's a column called ALBUM in the Plays table. Knowing that, we could modify our earlier SQL command like so:
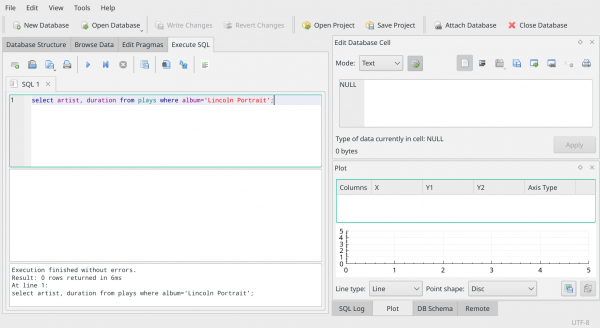
select artist, duration from plays where album='Lincoln Portrait';
Let's try that:
Oh dear. It seems logical enough, but the bottom panel is telling us '0 rows returned'. So the SQL statement is not erroneous -but it's not matching any data. Why not? Well, you could check again in the Browse Data tab. There you will find that my 'album' names are not simply names, but also include conductor's surnames and recording years. If you don't include them in your SQL statement, you won't match the data precisely, and therefore no rows will match and be returned.
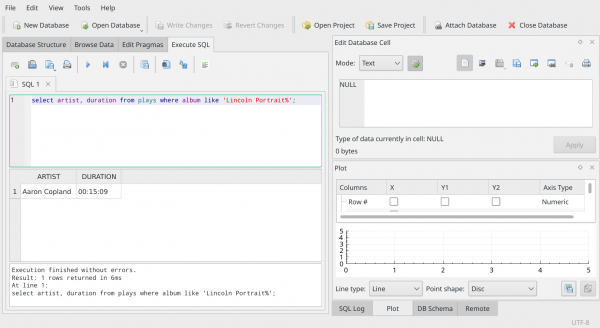
Fortunately, there's a trick we can use. Instead of saying a piece of data "must be equal to" (which implies strict matching), we can say that it should be "like" something, which is much less strict. If we edit our SQL statement to read:
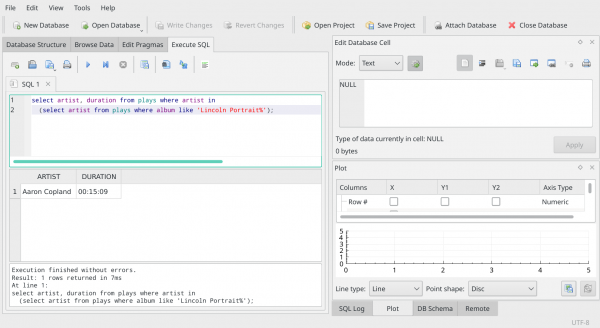
select artist, duration from plays where album like 'Lincoln Portrait%';
Notice that the equals sign has gone and has been replaced by the word 'like'. Also notice that we've added a percentage sign into the name of the Album we're trying to match. The percentage sign is a 'wild card': it stands in place of all the things we don't know enough about to specify. In this case, we don't know the conductor or recording year, so we miss those out and the percentage sign says 'match anything after the words 'Lincoln Portrait'. Let's execute that revised SQL statement and see what we get:
Bingo! Now we have some data -and we find that it was Aaron Copland that wrote the Lincoln Portrait, in case we'd forgotten!
But that's not quite what the original question was after, even so. Remember how it was phrased: "Find all plays of music by whoever composed Lincoln Portrait". This query finds the specific plays of Lincoln Portrait, and from that we now know Aaron Copland was its composer -but that's not the same thing as showing us everything that's been played which Aaron Copland composed!
Well, now that the first query has told us that we're talking about Aaron Copland, it would be easy to submit an entirely new query that really does answer that more subtle question:
select artist, duration from plays where artist='Aaron Copland';
Nothing wrong with that really -except it's now very hard-coded. That query's specifically and only looking for Aaron Copland. The fact that he's the composer of Lincoln Portrait has disappeared, and that requirement was in the original question. So there's a neat trick we can do instead, that fully and completely matches the requirement of the question: use a sub-query.
5.2 Sub-Queries
Hold onto your hats! We know that 'select artist from plays where album like 'Lincoln Portrait%' returns the answer 'Aaron Copland'. So if we wrap that query up in brackets, we can then use its answer inside another query, to provide the bit of data we're looking for.
In other words, we would write our query like this:
select artist, duration from plays where artist in (select artist from plays where album like 'Lincoln Portrait%')'
The bracketed bit of the thing supplies the data that the outer part of the query uses as its filter. We don't need to know that the composer is 'Aaron Copland': the bracketed bit of the query will supply that information for us, dynamically.
When you type in long queries like this, feel free to break the text up into appropriately-long sections, so that the display makes sense to you. The placing of line-breaks is irrelevant to the validity of the SQL statement as a whole. So typing it in like this is acceptable:
And you'll notice, too, that I've executed that broken-up statement... and the answer has come back in the lower panel just as before.
So now we're in a position to answer the original question: in fact, in this database, the only play by the composer of Lincoln Portrait was the very play of, er... Lincoln Portrait! There's only one row returned, after all.
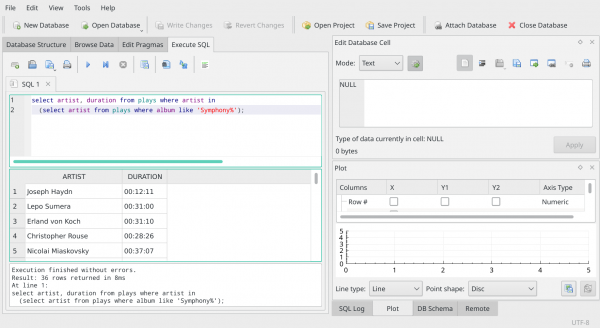
But imagine the question had been 'Show me composers we've played who have written symphonies'. The result then would have looked like this:
It's the same basic query+sub-query technique, but by changing the word in the sub-query, we now get very different results: 36 rows have been returned, not just 1. So there must have been lots of pieces written by people who also wrote symphonies that have been played.
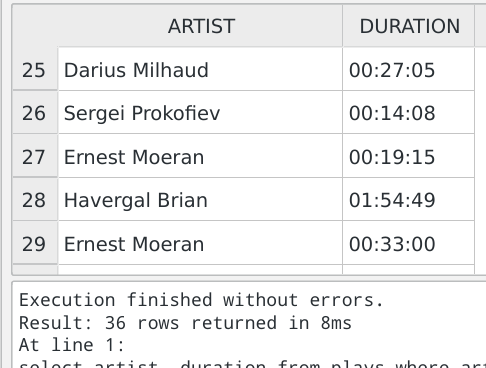
But there's a further wrinkle with this query. Take a look at the results a little more closely:
See how Ernest Moeran has appeared more than once? It's possible other composer names appear multiple times, too. The problem is, the Plays table stores one row per play. If we play something by Ernest Moeran 5 times, one of which happens to be a Symphony, then our query will return Ernest Moeran 5 times. But the original question was 'what composers have written symphonies' -and, in normal English, we wouldn't repeat a guy's name 5 times just because we played his music 5 times. We'd say 'Ernest wrote a symphony', once. So we need to do something to stop repeating data if we are not interested in seeing it specified for every row in the table but wish to see it de-duplicated or aggregated.
5.3 Summarisation
The magic word we use to de-duplicate data is distinct. If we say 'show the distinct composers who have written symphonies', we mean 'show a composer's name only once, even if we've played him 66 times!'
Beware, however, that 'distinct' truly removes only exact duplicates. The fetched data must match exactly if it is to be reported on only once. If some aspect of it is different each time it appears, then it cannot be reported only once -because then we'd be suppressing something special about the data.
I mean, for example: take our query at the point it's just reached:
select artist, duration from plays where artist in
  (select artist from plays where album like 'Symphony%')'
If we wanted a composer to be listed only once, no matter how many times we've played him, but provided somewhere along the line he wrote a symphony, we could try doing this:
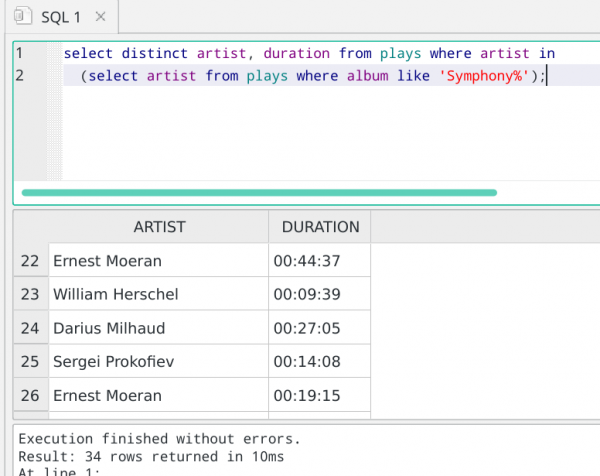
select distinct artist, duration from plays where artist in
  (select artist from plays where album like 'Symphony%')'
We just add the word "distinct" and that stops Ernest Moeran appearing multiple times? Well, no, because look what we're asking to be distinctive: the artist's name AND the duration of the thing being played. So imagine we had data of plays of something by Ernest Moeran that lasted 19 minutes, and a play of something else that lasted 33 minutes: the combination of the two pieces of data are unique and distinctive, therefore, both would be reported: the suppression of multiple mentions of the composer's name alone would not have taken place. We can see this in this screenshot:
Despite the 'distinct' in the query, Ernest is being listed twice -because, each time his name appears, the duration of the play is different. On the other hand, notice that this report now lists only 34 rows. When we originally ran it (about three screen shots earlier) without the 'distinct' keyword, it returned 36 rows. So clearly, two plays of something that had the same composer AND duration have been summarised into a single return by the 'distinct' keyword.
But anyway: the point is, if you want a list of composers we've played who wrote symphonies, but only list a composer once, no matter how many times we've played his music -we need the query only to worry about the composer's name, not the duration. So modify the query to this:
select distinct artist from plays where artist in
 (select artist from plays where album like 'Symphony%');
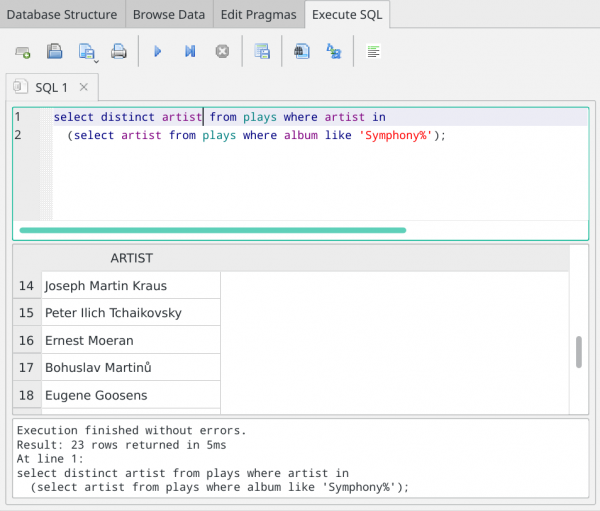
...and we're in business:
Notice that the 'duration' has gone from the outer query: it's only the artist name that has to be distinct. And, sure enough: Ernest Moeran appears only once in the resulting report, which now only contains 23 rows, not 36 or 34. By concentrating on what we actually needed to be distinct, we can now actually answer the original question: we've played the works of 23 composers who have written symphonies.
But...but... how do you know Ernest Moeran appears only once in the list? Sure, he only appears once in that screenshot. But I could have carefully framed that so that his next appearance in the list was at row 19, for example. That would be 'off shot', and you wouldn't know it was there!
And that brings us to the important subject of...
5.4 Ordering the Results
It is an inherent principle of databases and SQL that unless you specify the order in which rows should be returned, they will be returned in any order the database engine feels like. It might look like 'ascending numeric' or 'descending alphabetic', but unless you explicitly tell it the order, you cannot actually know the order.
So, you should get used to ordering your results with an ORDER BY clause, tacked on to the end of your (outer) query. In our case, something like this:
select distinct artist from plays where artist in
 (select artist from plays where album like 'Symphony%')
   order by artist;
...makes all the difference. Notice that the order by is affecting the outer query: we don't actually care what the inner, bracketed query is doing or in what order. It's supplying artist names to feed into the outer query, and if they come in Z, Y, X order, that's fine... so long as the final results are ordered alphabetically by Artist name.
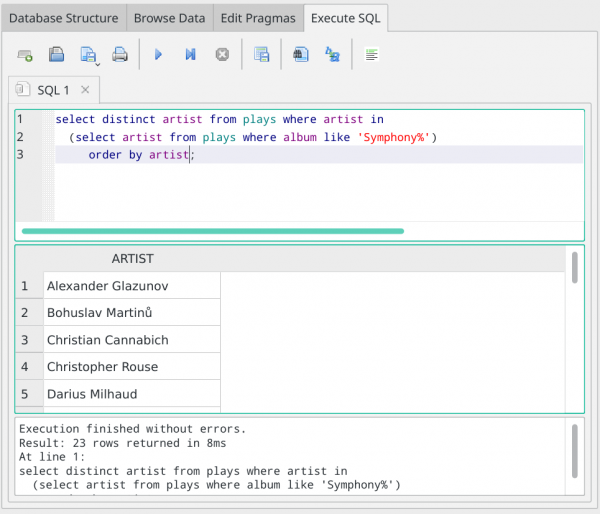
The results of adding this one little clause are quite distinctive:
You can see immediately that As are followed by Bs and then Cs. So when I scroll down a bit:
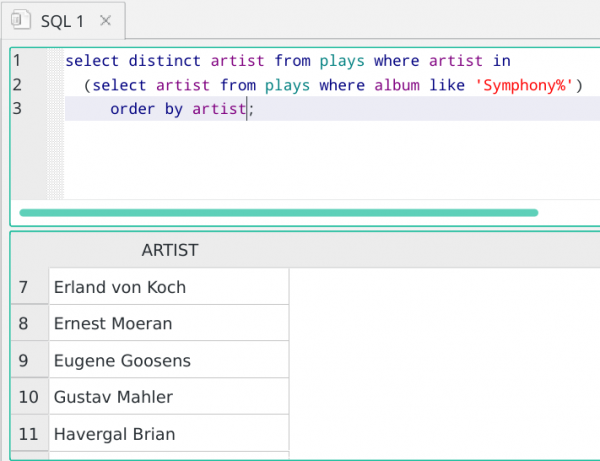
...you can see Ernest Moeran appearing once, but because we know this list is sorted alphabetically, we can be certain that he won't appear anywhere else in the list either, without having to read it all to check! That is, thinking logically, once an item in a sorted list is 'not-something', then you know that 'something' cannot appear anywhere else in the list.
5.5 Aggregation
I want to end this part of the article talking briefly about 'aggregation'. Aggregation is a form of de-duplication, but it has a more specific purpose: it is used when we want to count or measure something.
So, for example, and continuing to pursue the line of questioning I've followed previously: I now know there are 23 composers who have composed symphonies, and whose work I've listened to, and we know that Ernest Moeran is one of those. But how many times did I listen to each of those composers work, whether or not it was a symphony, provided only that at least one of them was a symphony?
(The questions are getting a bit contrived for the purposes of making a point, but bear with it!)
So now we are after a 'count of plays' -and that's a job for aggregation, not mere de-duplication. The basic form of an aggregating query is as follows:
select something, count(something) from table group by something
That is, it's no good just returning the 'count', you also need to return the label or identifier for the thing you're counting. It wouldn't be much use returning "5" on its own, for example: but if it said "Ernest Moeran 5", then that's being informative. The killer bit of SQL syntax, however, is the 'group by' clause: it's that which sorts all of Ernest's plays together (just like the order by clause does) but then aggregates them into a single row (which the distinct clause does) that can be counted (which the distinct clause doesn't do).
Our query this becomes this:
select artist, count(artist) from plays where artist in
  (select artist from plays where album like 'Symphony%')
    group by artist
      order by artist;
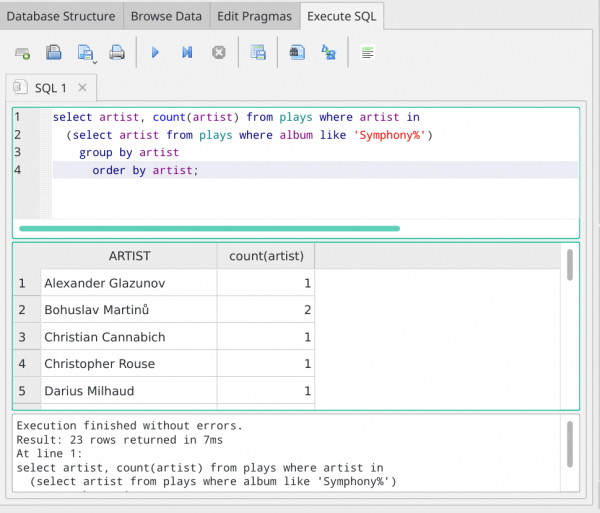
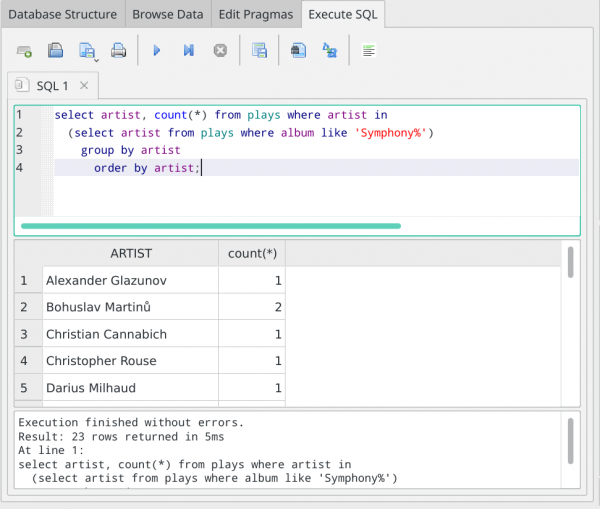
Note that the report should still be ordered: always order your reports with an ORDER BY clause, otherwise the database engine will do whatever it fancies in that regard. But the GROUP BY clause comes before the ORDER BY clause:
So now we know that we played two pieces by Martinů, only one of which had to be a symphony. We can't tell if both were symphonies from this report, but we know that at least one of them must have been.
It's not really terribly important, but you may as well know, too, that people who write SQL queries often don't bother to specify precisely what is being counted in the count(....) bit of the syntax. I mean, it's helpful to spell it out, because just from the column heading, you can see that I am counting by ARTIST as well as displaying the ARTIST column. But, usually, they don't bother: they simply stick an asterisk in place of the column name. So this works just as well:
Note the new asterisk in the query; the column name in the results part of the display has also changed... but the answers being displayed have not. The use of 'count(*)' rather than 'count(column_name)' is just a convenient convention and you can take it or leave it as you prefer.
(I will say that in 'proper', commercial databases, with huge data sets, the use of 'count(*)' is faster to computer than 'count(column_name)', so there are performance reasons for adopting the convention. But in the case of the AMP database, using SQLite3, and with the size of the data you're likely to be dealing with, it's not going to make a lot of speed difference which form of the counting function you invoke.)
5.5 Multiple Queries
I just want to wrap up this part of the article with this screenshot:
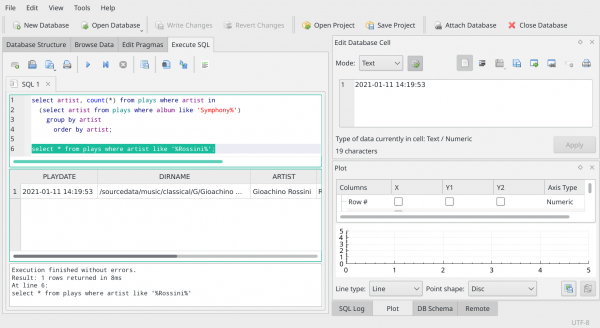
By this, I hope to explain to you that you can type lots of queries in that top left-hand panel. In this case, I've got our complex counting/aggregating-with-a-subquery one at the top and simple one about whether I've ever played anything by Rossini down below.
Note that you can do this if you end each individual query with a semi-colon, because then the tool knows where one SQL statement ends and another starts.
But the other thing to note is that I've highlighted the second query before pressing F5 (or hitting Ctrl+Enter, or clicking the big blue play button): when you have multiple SQL statements in the panel simultaneously, the one highlighted is the one that gets executed when you do any of those things.
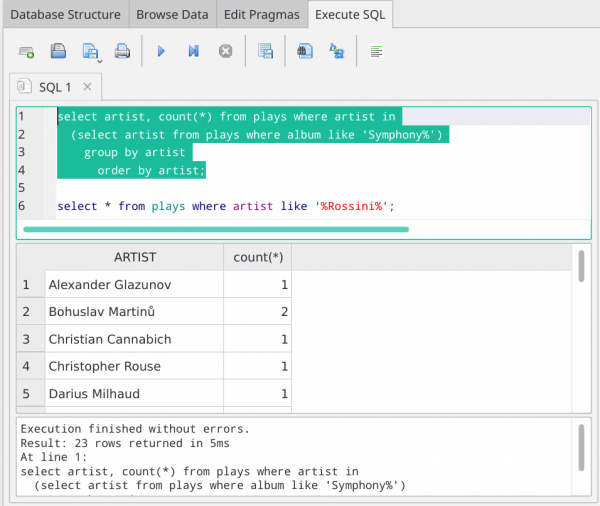
So, this, for example:
...is almost the same screenshot as before, except that I've highlighted the top query and then pressed F5, so the results displayed are those belonging to that top SQL statement.
If you are of a tidier-minded disposition, however, you can at any time type Ctrl+T, or click the 'New Tab' button, which is the left-most button under the 'Database Structure' tab. That gets you a second (and subsequent) tab in which to type new SQL statements, so you can have one SQL statement per tab, if you prefer doing things that way.
And one very final thing to point out in that last screenshot: notice how I wasn't sure of Rossini's first name, nor whether he might have something after his name in my database. I therefore used the '%' wildcard character both before and after the bit of data I was sure about, in order to achieve a data match. Previously, we only used wild cards at the end of something we knew, but if you are only confident about something in the middle of a piece of data, you can use wildcards like this to give you the best chance of a successful data match.
6.0 Graphs
6.1 Directly Graphing Data
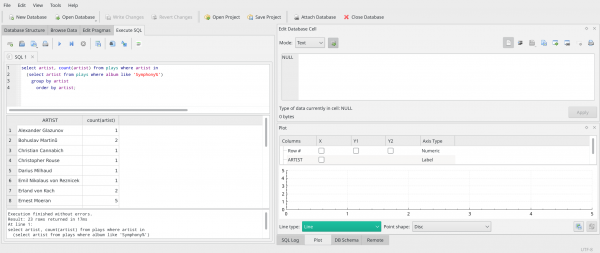
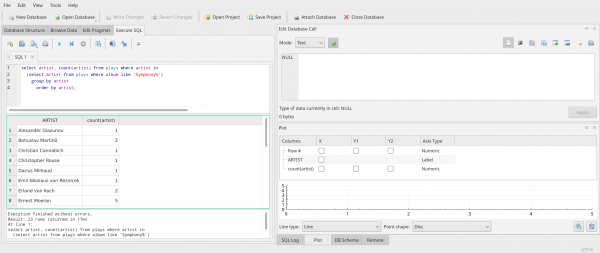
Without wanting this article to get too complicated, I want to draw your attention to the right of the DB Browser screen when we're running our earlier counting query:
Notice that the right-lower panel has a number of tab-options underneath it: Log, Plot, Schema and Remote. Click on the 'Plot' one as I've done here: the display above that doesn't currently look too exciting!
But if you click-and-drag the horizontal line that appears under the word 'ARTIST' in that part of the screen (and above the number 5), you'll see that you can resize things so that the lower-right panel can display more 'stuff'; than it's doing in that earlier screenshot:
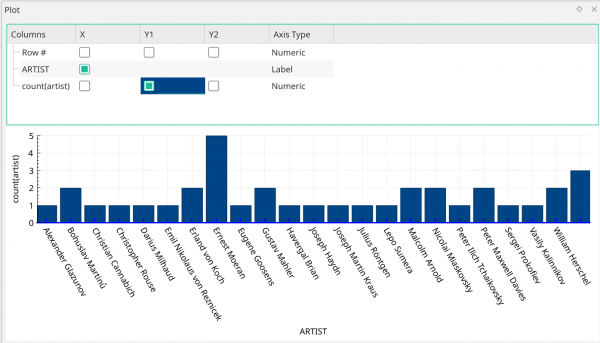
Here, I've resized it so that it has revealed the existence of a 'count(artist)' item, with three check-boxes in columns after it. This panel is inviting you to specify X and Y axes for a graph. Assume, for example, that the counting taking place over on the left-hand query panel should be plotted on the Y axis: the more plays a composer has had, the taller or higher it's plot point should be. Then the X axis would be each composer's name.
Let's run with that anyway: here's how you'd configure that right-hand panel to display that combination of axes and data:
See how I've 'switched on' the checkbox in the X column for 'ARTIST'. That means that data from my left-hand side query will be plotted on the X or horizontal axis. And you can see that I've asked for the counts of each artist's plays to be plotted on the Y1 axis. (More complicated graphs can have two Y axes, but let's not go into that now!)
So that's switched on how we want things to plot... where's the actual plot?! Well, if you make this plot configuration screen too big by dragging the divider downwards too much, it might make the plot area disappear, so you'd then have to re-drag the horizontal line upwards a bit to reveal it. Or make the entire program display go full-screen: fiddle around with dimensions sufficiently, and you should see this:
Now, as graphs go, it's not exactly exciting stuff! But it is a graph, produced directly from data held within your AMP database (and it's a convenient way of seeing that I'm playing way too much Moeran!) You can click-and-hold on the graph area to scroll left and right, so that it the graph falls off the end of your screen's display area, you can nevertheless see all the graph eventually.
The fundamental point to take away from this is that if you can produce a report of it on the left-hand side of the screen, thanks to a cunning piece of SQL, you can probable pick 2 bits of data from it on the right-hand side 'plot' part of the screen and have those two bits of data plotted on simple X/Y Cartesian graph of one sort or another.
Right-click the graph area itself to get an option to copy the graph (into a word processor document, for example), or to print it out directly. Underneath the graph area, too, there's a button to save the graph as a PNG graphic (again, for import into a document of some sort, or maybe a web page). You can also scroll your mouse-wheel forward and backwards whilst hovering over the graph plotting area and scroll into and out of the graph at will. It's quite basic functionality -but it's not bad for free and directly-generated!
6.2 Indirect Graphs
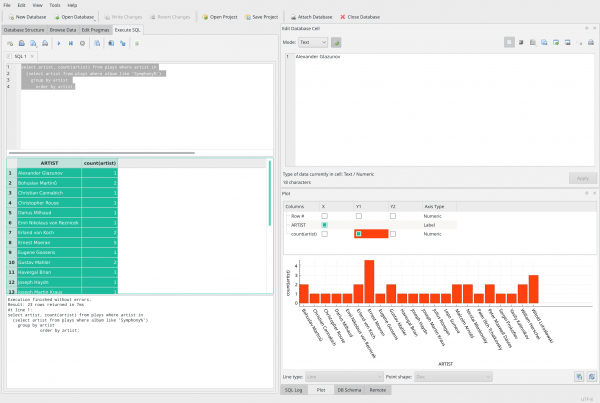
To wrap things up, let's switch back to the left-hand SQL query area of the program display:
It's not terribly obvious, but if you click in the little 'square' of border that sits above the '1' row number and to the left of the 'ARTIST' column in the results part of the screen, as you can see, the entire set of results turns green (i.e., gets highlighted). Once they're selected in this way, just right-click anywhere in the highlighted area and select 'Copy with Headers' from the context menu that appears.
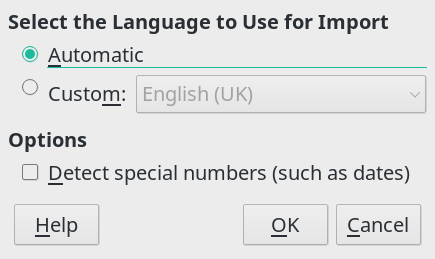
Now open up your spreadsheet program of choice (for most Linux users, I think, that's going to be LibreOffice's Calc) program. Once opened in a new, blank spreadsheet, just right-click and select 'Paste' from the context menu. You might be asked this:
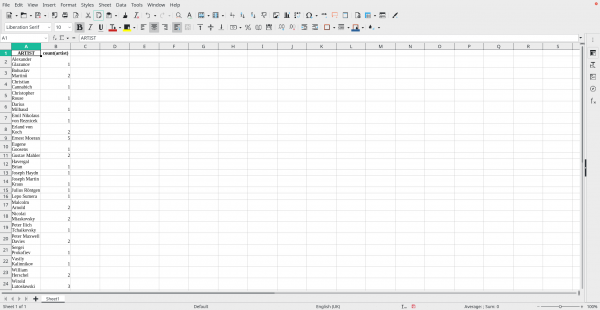
...at which point, it's OK to click [OK] to accept all defaults. You'll probably end up with this sort of mess:
Calc doesn't do a great job in the way it formats the results -different rows have different heights, for example. But at least your database data is now in a spreadsheet -and, once it's there, you can do to it anything you can think of doing with a spreadsheet! If you are a dab hand at functions and statistical analysis, for example, you could compute the mean number of plays of these composers; the deviation from that mean; and Lord knows what else!
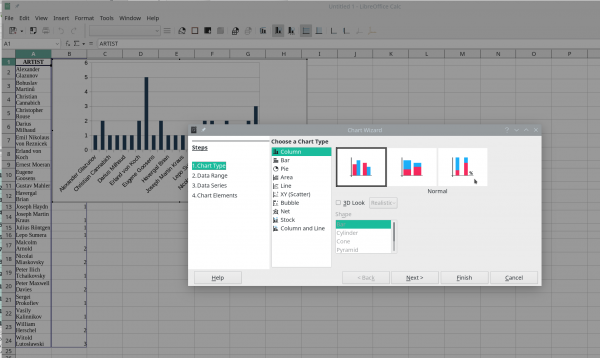
Me: I shall stick to clicking the Insert > Chart menu options:
Now, this isn't a tutorial in how to use Calc, so I'm not going to go through every step of the process here, but you can actually see from that screenshot that Calc has already worked out where the data is in the spreadsheet behind the current Chart Wizard dialogue. It's even assumed a bar-chart and is displaying that in the background. But that doesn't stop you stepping your way back and forth through the wizard and making your won choices on how to graph this data.
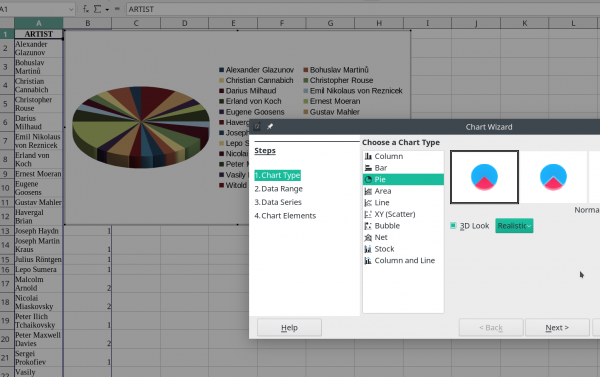
Let me select a realistic, 3D pie chart instead of a simple bar graph, for example:
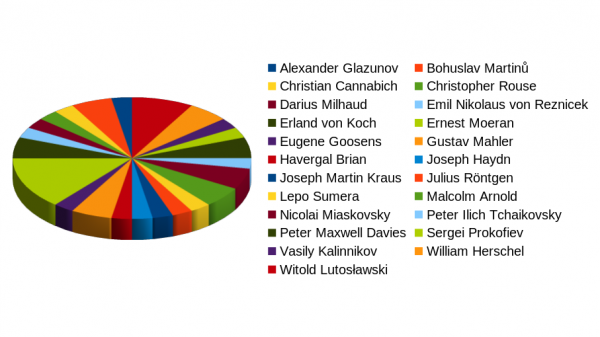
Again, in the background, you get a preview of what your chart will look like when it's finished. Keep on stepping your way through the wizard, and you might end up with something looking like this, for example:
I'm not saying it's a particularly sensible way of displaying this data! But I am saying that Ernest Moeran is clearly taking up more than his fair share of the pie!
The real point here is that by highlighting the results of a query in the DB Browser, you can copy-and-paste them into spreadsheet and word-processor programs and thus bring all the graphing, calculating and formatting finesse that those programs can bring to the business of displaying data in meaningful and attractive ways. Your AMP playing data doesn't have to be displayed (as we started with) in boring old fixed-content text columns -but can be retrieved to answer any question you can think of framing in a SQL statement and then displayed in fetching and exciting ways such as pie charts, x/y scatter plots and who knows what else!
7.0 Conclusion
The fundamental reason for this article is to show you that you can get familiar with your play history over time -and use the tools I've described to investigate that play history, to spot trends and possible 'issues' (maybe you're playing one type of music too much: the GENRE for each play is in the Plays table, for example, so counts and aggregation by genre are more than possible).
Remember, too, that AMP has a table of ALBUMS which contains data about your entire music collection, whether it's been played or not. Would you like to know whether Haydn is over- or under-represented in your collection compared to -say- Mozart, for example: it's all do-able with a SQL statement selecting from ALBUMS rather than PLAYS.
My point is that being able to investigate your music collection and your play history in the aggregate can reveal shortcomings or interesting patterns you might want to fix for the future, or deficiencies you might want to make up... but if you don't have the data, you can't do anything about it.
Well, I hope this article has shown you that AMP gives you that data, provided only that you're brave enough to take a look and experiment with some SQL now and again!
In a second article, I shall delve into the slightly more complex issue of how you connect a spreadsheet up to the AMP database directly, without needing a program like the DB Browser to do that for you. But that's a story best left for another day, because it gets fiddly and complicated really quickly! For now, enjoy cutting and pasting your data into a spreadsheet and doing things indirectly!
