 I've been aware for years that it's possible to produce the sorts of images you see in the thumbnail at the left of this post: frequency analysis graphs of an audio file of one sort or another. Audiophiles have been swooning over them for years, but I never have. If my ears were satisfied with the sound of a recording, what additional good would it do me to do a spectrum analysis of that recording?
Well: for the most part, I still think that's true... but I had a very specific reason for dabbling in them lately, which then led me down the rabbit hole of finding them fascinating! I thought I'd share a little about it.
For starters, I've been ripping music from CDs to hard disk since 1998. Back then, hard disks were relatively small and expensive and I accordingly did my first-ever CD rips to 128kbps MP3... which is an utterly disastrous thing to have done! MP3 is lossy, meaning data from the audio signal is simply thrown away in pursuit of smaller file sizes. Allegedly the data that is thrown away will be taken from the inaudible part of the audio spectrum, so no-one will be the wiser -but that's not always true. Secondly, 128kbps is an exceeding slow sampling rate and results in inherently lousy audio compared to the original CD's 1,411kbps.
It didn't take me long to realise the folly of my ways, so I swiftly stopped ripping like that and started ripping to 192kbps WMA! This sounded a bit better, but WMA is not only another lossy audio codec (so audio data is thrown away) but it's also Microsoft-proprietary, which poses problems when you want to stop using Windows and start using Linux!
It wasn't until my third round of ripping attempts that I bit the bullet on using (a) open source codecs only and (b) lossless audio codecs. Third time around, I started ripping to FLAC (and have never stopped since!) The use of FLAC ever since then is another reason why spectrum analysis of audio signals has never really interested me: the entire audio signal is there by design, so what's the point in analyzing it further?!
Well: fast forward to about three nights ago, when I'm listening to a piece of Vivaldi and I subconsciously think, 'That's a bit 'off'!' -i.e., the sound was a bit dull, a bit flat (in 'texture', not key!) I idly wondered if this one Vivaldi track was one of my original MP3s that I'd forgotten to re-rip as a FLAC. How could I tell?
Well, a bit of research indicated that a program called Spek can be installed freely on Windows, macOS and Linux which will display a spectrum of the audio signal associated with pretty much any digital audio file. On Linux, I can launch it from the command line with something similar to:
spek "RV 588 Gloria (Leusink - 2000)-16.flac"
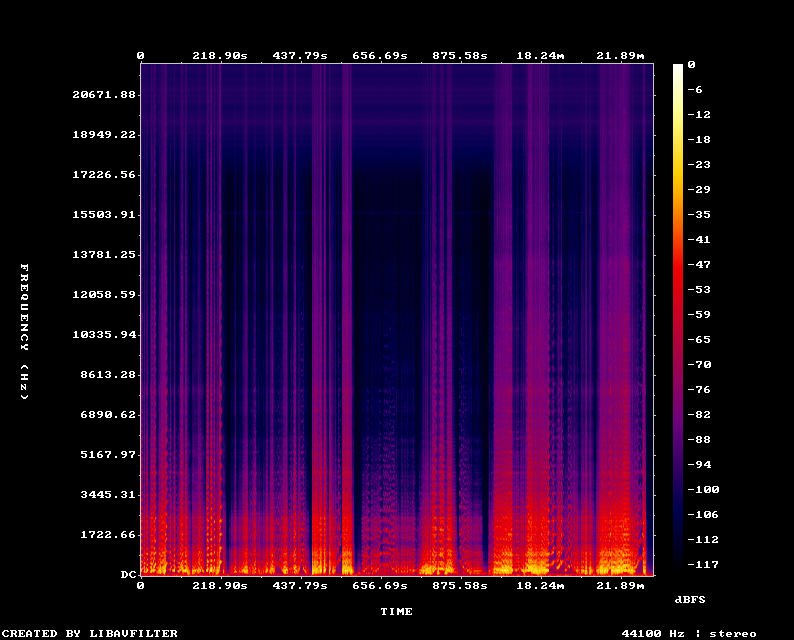
...which produced this:
We have time through the recording running along the X-axis (so this particular recording is around 29 minutes long). On the Y-axis, we have frequency (in kilohertz, or kHz), and the colour of the points drawn indicates (as per the right-hand Y-axis) the intensity of, or energy contained within, the sound at that point. Yellows and reds are powerful, whilst blues and purples are less intense. Meanwhile, blacks are 'doesn't actually exist'! So this graph shows that we have lots of sound below 5kHz, but that it rapidly trails off after that, getting very low-powered around 15kHz. Crucially, you'll notice that there's quite an abrupt cut-off of all sound energy above a little bit higher than 15kHz: that's a dead giveaway that the audio signal has been subject to a filter that simply discarded all frequencies above about 16kHz -and that's a sign of an MP3 that has been upsampled to look like a FLAC. That is, I must indeed have ripped this as an MP3 at one point and then simply used an audio converter to make it 'become' a FLAC file. Its file extension suggested it was lossless music, but its contents were merely a lossy MP3 in new clothes.
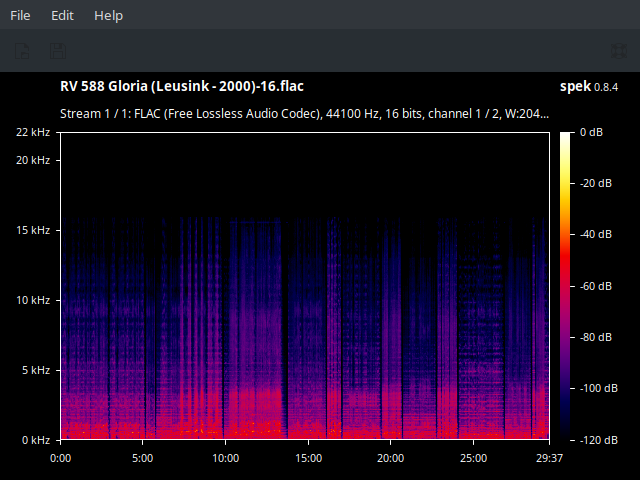
I immediately went and re-ripped this work from the original CDs, this time as a 'proper' FLAC:
It's the same 'work' as before -but can you now see that the 'curtains of purple' extend way above the 15/16kHz mark, right up to the 20/22kHz area. This is the data which the previous really-an-MP3-rip had just thrown away, but now it's there in the 'real' FLAC once more.
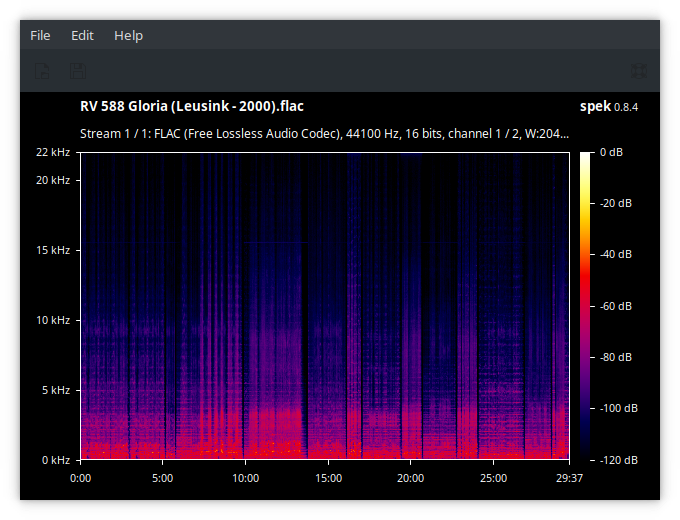
So it turns out that spectrum analysis can be really quite helpful in untangling the messy past of a music collection that has been arrived at by nearly a quarter century of learning and ripping and making mistakes! Naturally, I started wondering about other files in my collection! Here's one that concerned me, though:
That's from a rip of a brand new CD I bought, so there's no question the audio has never been within a mile of an MP3 codec! And, sure enough, the audio signal appears to extend well above the 15kHz/16kHz area, so that kind of confirms this is a "genuine" FLAC. But... but.... why does the signal flatline like that at the 20kHz mark? That doesn't look very 'natural' or, indeed, lossless!
In fact, there's another program you can install for free on Windows, Linux and macOS called the Lossless Audio Checker (invoked with the 'LAC' program name from the command line in Linux) which can be 'fed' a WAV file and will tell you what it thinks. Here's me feeding a WAV (lossless) conversion of that above Wagner FLAC to LAC:
LAC "Antal Doráti - Richard Wagner - Der fliegende Holländer CD1.wav"
Lossless Audio Checker 2.0.5
Copyright (c) 2012-2016 Julien Lacroix & Yann Prime
http://losslessaudiochecker.com
==================================================
File: Antal Doráti - Richard Wagner - Der fliegende Holländer CD1.wav
Result: Upsampled
So: the graph tells me it has audio signals up to 20kHz, indicating 'genuine FLAC', but there's a strange, hard cut-off at 20kHz... and now LAC is telling me it thinks the file is merely 'upsampled' audio, not genuinely lossless! All the while, I know I literally just ripped this audio from a CD... so what's going on?!
Well.. this is where classical music fans have things a bit tougher than those who listen to contemporay 'popular' music: our recordings tend to come from a time before the digital era. In this particular case, Antal Dorati recorded The Flying Dutchman in 1960, long before the days of digital recording. So, the audio on this CD genuinely is 'upsampled', because it was constructed from an analog recording, which probably used less capable microphones and other recording equipment than we'd use today.
The upsampling LAC detects, therefore, is something the record company has done to construct a digital recording out of analogue whole-cloth, not a mere conversion of a lossily-compressed file to a lossless format, as in the previous example. Back in 1960, the entire audio recording chain of equipment had a tendency to drop 'inaudible' treble above 16kHz... pretty much as MP3s are designed to do today. It's difficult for LAC to distinguish between them, therefore -though the spectrum going all the way up to 20kHz, albeit faintly, is your clue that this is not an MP3 file that's been post-processed.
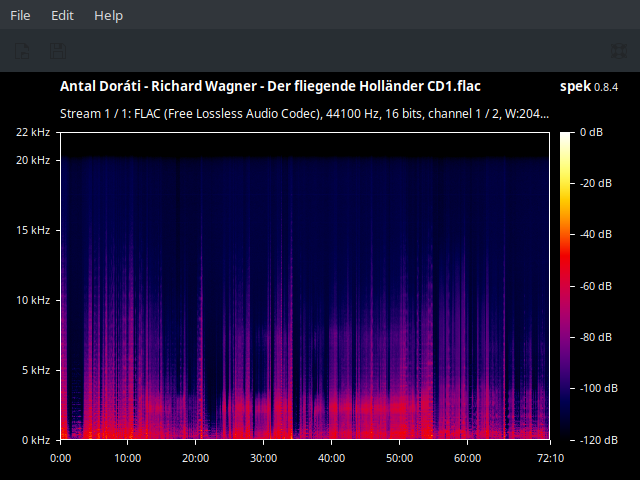
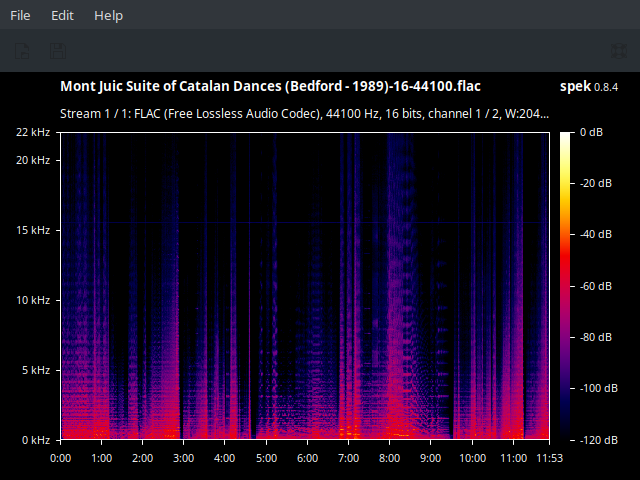
By way of contrast, here's the spectrum for a rip of a 1980s (thus, entirely digitally-produced) CD:
Here, the signal goes up comfortably above the 20kHz range and only stops around 22kHz (half of the 'natural' sampling rate of standard CD Audio of 44.1kHz). So, modern, all-digital classical music recordings ought to look more like this example, with some audio signal going well above 20kHz -but old analogue recordings that were converted to digital for re-release on CD probably won't look like that at all, though even then re-mastering tricks can work miracles.
Ultimately, I guess: if your ears cannot tell whether something has been upsampled or digitally manipulated, does it matter that your eyes can maybe/sort-of work it out? Perhaps not.
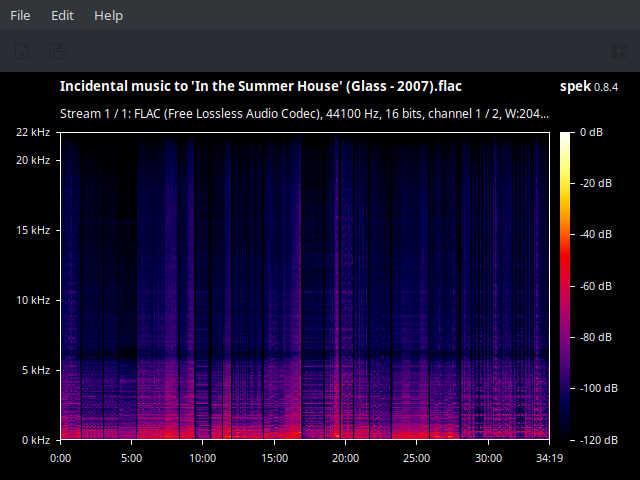
But I did find other things interesting to note when checking on some recordings using this technology. Here's a FLAC digital download purchased fresh last night from Prestoclassical, for example:
The signal is obviously going right up to the 22kHz range, so no question that this is a digitally-recorded recording and that it's a 'genuine' FLAC version of it. What I found intriguing, however, was the solid horizontal line visible throughout the recording at around the 16kHz mark:

It's faint, but it's definitely there ...and it's not present on the three other recordings that came on that same CD, so it would appear not to be an artefact of the recording process. This recording was made in the Snape Maltings in Suffolk in 1990, so it's possible that the recording engineer had a PAL television monitor running at the time, as 15.625kHz was the horizontal scanning frequency of PAL TV sets of the era. If so, it remains a mystery why they turned the set off for the other recordings, but not this one! In any event, I can't hear any continuous high-pitched tone on the recording, so its undoubted presence on the recording doesn't bother me... but I wonder if it would be detectable by, say, a 16 year-old with 'golden ears'!
Finally, I wondered whether any of the 'high resolution' audio files I have recently (and only occasionally!) been buying were genuinely high-res. Here's one:
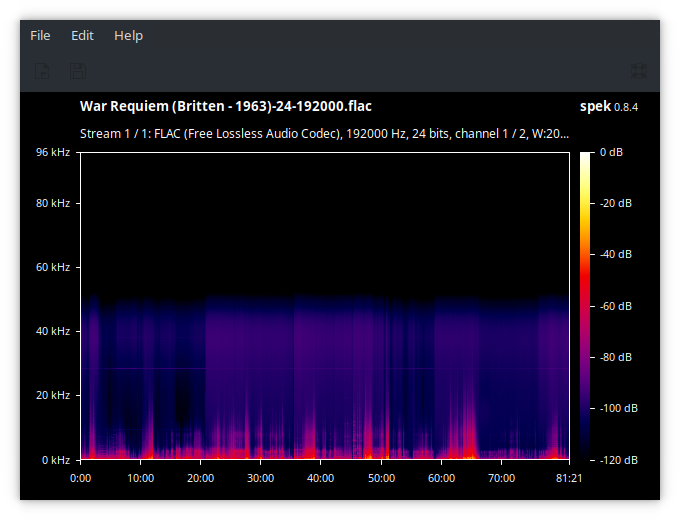
You have to pay attention to the vertical axis scale for this one: at first glance, after all, it looks like there's a hard cut-off of the audio signal at quite a low level, which indicates "bad things"! Check the scale, however, and you can see this is a graph of an audio signal that's extended well into the 40 to 50kHz range, more than double what a 'standard CD' would do (and all that data would be completely inaudible to every human alive on the planet, so spending deliberately to acquire it is a bit daft. My excuse is this was available for £3 from a charity shop, so why not?!). So this genuinely is a 'high resolution' SACD-style audio signal (though how they managed to get that from a 1963 analogue recording, I have no idea: remastering can do such wonders, however, I have no doubt!)
Anyway: I thought it was interesting, though I mention all of this with a huge note of caution: once you start investigating your audio files in this way, it's difficult to stop; and recordings you have loved for decades suddenly become suspect, because their spectrum raises questions or doubts! Trust your ears first, is what I'd say: if it sounds OK, it's probably OK, and you needn't inspect things much more closely. Where you ears are throwing up the doubts, however, then this sort of spectrum analysis can be a source of confirmation that something's 'up', or reassurance that the signal looks as it's supposed to.
It is for this reason that I'm adding the abilty to generate a spectrum analysis of the first FLAC in a folder to Semplice, when it's first revision is released sometime in early January. It seems to me a capability that a FLAC manager ought to have, and I've certainly found it fascinating to subject some of my files to its penetrating gaze in the past couple of days... but I do need to learn when to stop digging!